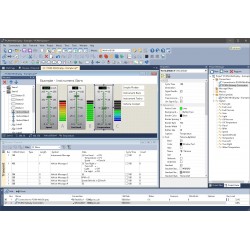
The Plotter Add-in allows the recording and graphical representation of any number of signal courses. Signal sources can be the data from incoming and outgoing CAN messages as well as virtual variables and results from macro calculations.
Real-time display of signal courses
Unlimited number of recording channels
Unlimited number of Y-axes
Decoupling of the configuration of Y-axis and channels to improve presentation and handling
X-axis and Y-axes can be zoomed and scrolled freely, even during recording
Labelling of time axis with absolute or relative time stamps
Facility for automatic adaptation of axes to plots
Reversible Y-axes
Logarithmic scales
Cursor display for plot measurement
Save the current view as an image in EMF, PNG, BMP, or JPEG format
Export the recording to a CSV file
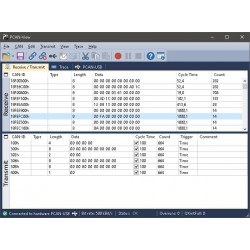
Import of data recordings from the PCAN-Explorer?s tracer, from PCAN-Trace, or PCAN-View